
PRODUCTS

ADVANCED TRADING PLATFORMS
Custom Trading Platforms based on your methodologies.
The Analytix advanced trading platforms leverage proprietary algorithms, charts, indicators, and strategies to enhance your edge in the market. Design a custom trading platform based on your methodologies, including Volume Profile, Order Flow, Price Action, Support and Resistance, Momentum, Market Structure, plus many more.

AUTOMATION
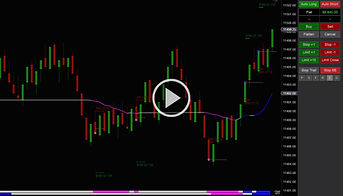
Advanced Trade Strategy Automation and Financial Risk Management.
This video provides a demonstration of an advanced trade strategy algorithm for order flow imbalances and cumulative volume delta. When the automated algorithm criteria is identified, the strategy will place a trade entry order and manage the trade based on the risk management parameters defined by the trader.
AUTOMATION - HFT
Automated High Frequency Trading.
This video provides a demonstration of an automated high frequency trading algorithm executing over 300 long and short trades in 2.5 hours based on predefined criteria. The automated strategy submits a limit entry order each time the predefined algorithm criteria is identified, adding to existing positions if open. Once the limit entry order is filled, the automated strategy immediately enters a stop order and profit target order to manage risk and protect profits.

MARKET LIQUIDITY MAP
The Market Liquidity Map tracks current and historical full depth of market liquidity.
The Market Liquidity Map tracks full depth of market liquidity over time using a visual heatmap to identify high probability trading opportunities. High levels of liquidity provide insight to the price levels where buyers and sellers are placing their limit orders.

VOLUME PROFILE
The Volume Profile displays trading volume at specific price levels.
Volume Profile is an advanced charting study that displays trading activity over a specified period at specific price levels. The Volume Profile plots a histogram on the chart to reveal significant price levels based on volume.

ORDER FLOW FOOT PRINT
The Order Flow Foot Print provides a real-time price, volume and order flow.
The Order Flow Foot Print provides direct visibility inside the chart bars to track buyers, sellers, volume and order flow within each bar. This provides a real-time trading edge and allows more precise entries and better timed trades. Identify areas of strength and weakness based on the interaction between supply and demand to understand which side is in control.

LEVEL 2 VISUALIZER
The Level 2 Visualizer displays current and completed bid/ask quote data.
The Level 2 Visualizer is a real-time bid/ask histogram at current price levels including a vertical gauge for current bid/ask pressure. Also included is a vertical gauge that displays completed order delta for the current bar. This allows a visual representation of the current and completed buy/sell pressure.

MOMENTUM TREND
The Momentum Trend provides price direction and acceleration trend analysis.
The Momentum Trend measures the amount of an instrument’s change in price over a given period to calculate the direction and acceleration of price movement. As momentum increases or decreases, the trend can be plotted to detect an instrument’s strength or weakness which will assist in identifying opportunities to enter or exit trades.

DYNAMIC SUPPLY & DEMAND ZONES
The Dynamic Supply & Demand Zones provides real-time support and resistance levels.
The Dynamic Supply & Demand Zones are calculated and displayed in real-time to provide a visual on where price action may find support and resistance. The zones are customizable and can be configured to calculate on multi-timeframes allowing higher and lower timeframe zones to overlay your charts.

VOLUME WEIGHTED AVERAGE PRICE
The Volume Weighted Average Price calculates the price average weighted by volume.
The Volume Weighted Average Price is a moving average of price weighted by volume. VWAP is a powerful tool for an intraday trader to identify the strength or weakness of an instrument. VWAP can add more value than standard moving averages because the VWAP reacts to price movements based on an instrument’s volume during a given period.

AUTOMATED UNISCALPER
The Automated UniScalper takes directional breakout trades on any instrument.
You choose the direction, long or short, and the automated strategy will find the entry point and place your orders. Once filled, the automated strategy will manage the trade using predefined stops and targets, or you can use your own Advanced Trade Management preferences.

STOCHASTIC TRANSFORMATION
The Stochastic Transformation Indicator provides reliable Buy and Sell signals on all instruments.
Use the Stochastic Transformation indicator to identify key reversals points on all instruments and time frames. The indicator plots easy to read Buy and Sell signals on the chart. Custom automated and discretionary strategies can be developed from this indicator logic to manage trade entries and exits.

SWING SCALPER
The Swing Scalper Indicator identifies trend range breakouts.
Use the Swing Scalper indicator to identify trend range breakouts on all instruments. The indicator tracks support and resistance zones and provides signals when a continuation trade is available. Typical breakout trades move fast and can be scalped or trailed with a tight stop using an ATM strategy.

EXTREME REVERSAL
The Extreme Reversal Indicator highlights key reversal candles.
Use the Extreme Reversal indicator to monitor for reversal patterns on all instruments and time frames. The indicator will provide Buy and Sell signals on the chart. Custom automated and discretionary strategies can be developed from this indicator logic to manage trade entries and exits.

STOCHASTIC MULTIPLE TIME FRAME
The SFTMTF indicator combines trend direction from multiple time frames.
Use the SFTMTF indicator to track multiple time frame trend direction all on one chart with one easy to read view. You configure the timeframes to track and the indicator uses a stochastic transformation to determine trend direction allowing you to trade with the trend.